IN THIS ARTICLE
Using Profiler for VRAM
You can use the video memory profiler (VRAM profiler) to determine which resources are contributing most to runtime VRAM usage in your game.
The VRAM profiler records the amount of video memory used by a game, including how many memory deallocations and allocations occurred during the capture. This latter information is useful in tracking down rendering performance bottlenecks.
You can also use the memory usage information from VRAM profiler to determine your game’s minimum memory and GPU.
Topics
Notes
The VRAM profiler has the following attributes:
- The VRAM profiler has no graph view or tree view.
- O3DE uses a variety of memory pooling schemes, so the actual allocated amount of VRAM is slightly more than what is reported.
Understanding the Captured Data
The following image shows how your saved .csv file appears in a spreadsheet application:
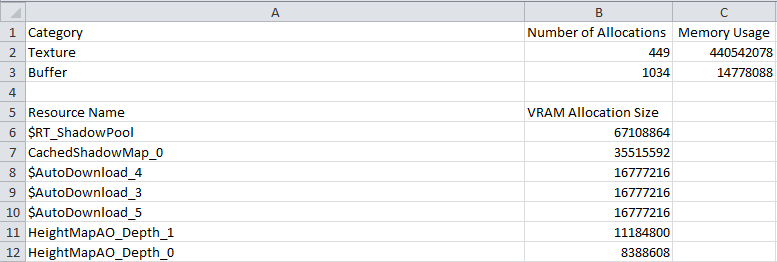
The captured data contains essentially two tables of information: an overview of memory allocation and usage (divided between texture and buffer assets), and a list of resources with the amount of VRAM that was allocated for each during the capture.
Detailed information about each heading follows.
Category Indicates the type of allocation:
- Texture - Includes texture assets, dynamically generated textures, and frame buffers.
- Buffer - Includes vertex and index buffers, constant buffers, and other runtime buffers.
Number of Allocations The number of allocation events recorded. When the capture starts, all active allocations are sent to the profiler as a starting number. Any new allocations or deallocations will increase or decrease this number.
Memory Usage The total size, in bytes, of VRAM used.
Resource Name The name and full path of the allocated resource. A resource name without a path usually denotes a runtime engine resource.
VRAM Allocation Size The size, in bytes, of the allocation.
Inspecting the Data
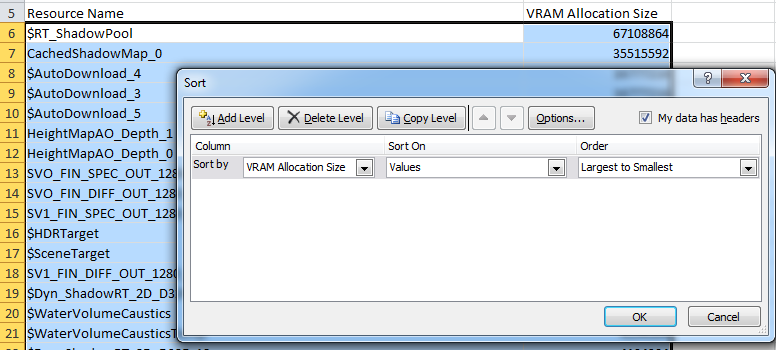
When you first open the spreadsheet, the data is unordered. To sort the data, you can use a spreadsheet application:
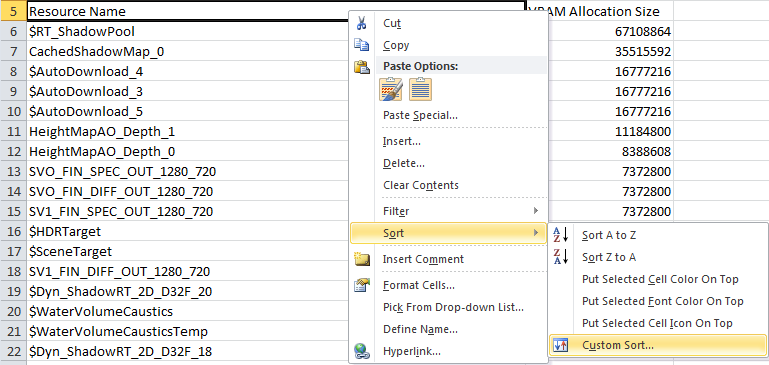
To quickly and easily identify the largest offending assets or runtime resources, sort by VRAM Allocation Size in descending order, or by Resource Name from A to Z:
Negative VRAM Allocation Sizes
Some fields may have a negative number for VRAM Allocation Size, as in the following image:

These important occurrences show that a VRAM deallocation event occurred during the capture. If you observe a large number of deallocation entries over a short time period, your game might be experiencing a significance decrease in performance. To improve your game’s performance across all operating systems, you should aim to have as few idle per-frame VRAM allocations and deallocations as possible.
Why Some Textures Are Not Reported in the .csv File
If you see a lot of allocations named StreamingTexturePool or entries like $TexturePool_9_0000000002C59248, this means the texture streaming system is active. The texture streaming system allocates all textures by default into a variety of cached texture pools. The VRAM profiler reports the size of the active streaming pools and not the names of the actual texture assets. To obtain the names and sizes of the allocated and loaded textures, set r_TexturesStreaming=0 in your system configuration file, and then do another capture. This setting disables the texture streaming system and causes the true sizes of the texture allocations to be reported.
Note:In this situation, it is advisable to do two captures: one withr_TexturesStreamingenabled, and one with it disabled. When texture streaming is enabled, your VRAM usage is less because of texture eviction and the loading of lower resolution mipmap levels. The memory reporting is more accurate when texture streaming is enabled, but you get a much clearer view of your worst-case memory usage when texture streaming is disabled.