IN THIS ARTICLE
Using the Profiler for CPU Usage
The CPU profiler gathers usage statistics about how long a function or method executed, how many times it was executed, who called it, and how much of a frame was spent on it. You can combine this information to get a systemwide view of usage, or isolate particular systems by filtering for specific threads.
To use the CPU profiler
- To open the detail view for the CPU profiler, click the Detailed Profiling Information icon for the CPU profiler instance.
![]()
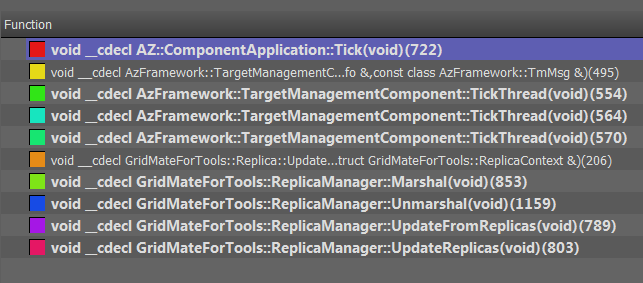
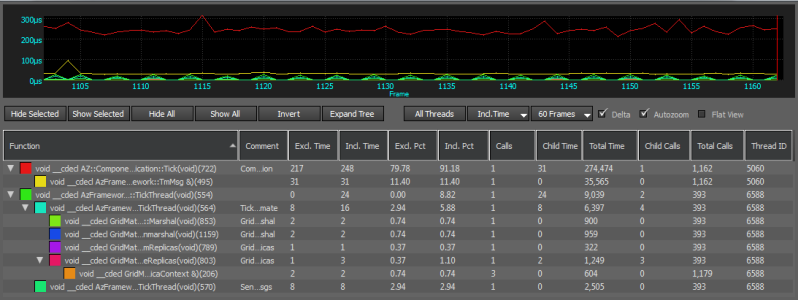
The CPU details view has a graph of CPU usage, a toolbar, and a tree view of calls made in a frame. Each call in the tree view has the same color as its corresponding line in the graph:
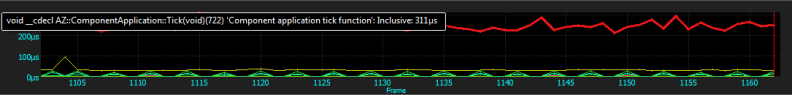
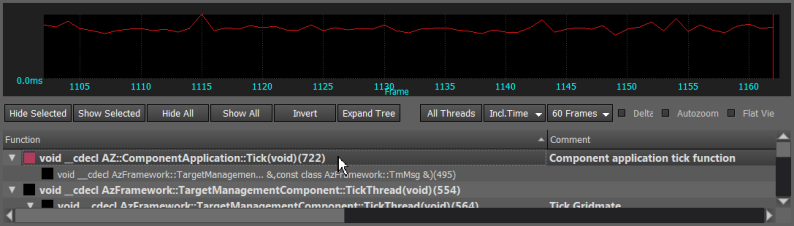
- Pause your mouse on a line in the graph to see the call that the line represents and to display the specific value for the graph at the area near the cursor.
- To show or hide the line graph of a row in the tree, double-click the row.
Understanding the Tree View
The CPU profiler tree view represents a call hierarchy of profiler log points (called hooks). A profiler hook that is active while another call is active shows as a child of the first hook. The hooks act as a stack: The last hook that was pushed onto the stack is the parent of the hook that was pushed onto the stack before it. The tree view has the following information:
Function The function declaration where the profiler data point was generated.
Comment A user-defined message that distinguishes specific events in the same function.
Excl. Time (Micro) (Exclusive time) The time, in microseconds, spent executing this function and no other functions called by this function.
Incl. Time (Micro) (Inclusive time) The time, in microseconds, spent executing this function and other functions called by this function.
Excl. Pct (Exclusive percent) Exclusive time represented as a percent of total run time.
Incl. Pct (Inclusive percent) Inclusive time represented as a percent of total run time.
Calls The number of calls to this function.
Child Time (Micro) The time, in microseconds, that functions that were called by this function took to execute.
Total Time (Micro) A running total of the time, in microseconds, that was spent inside of this function.
Child Calls How many functions this function called.
Total Calls The running total of how many times this function was called.
Thread ID The thread on which this function was executed
Controlling the Display
You can use the toolbar to control how the captured CPU data is displayed:

Hide Selected Hide the graph of the rows selected in tree view.
Show Selected Show the graph of the rows selected in tree view.
Hide All Hides the graph of all rows in the tree view.
Show All Shows the graphs of all rows in the tree view.
Invert Shows graphs for all rows in the tree view that are hidden; hides the graphs of all rows in the tree view that are showing.
Expand Tree Expands all rows in the tree view hierarchy.
The right side of the toolbar offers more options:

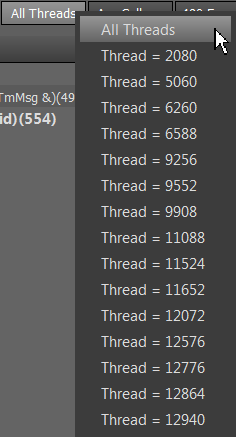
All Threads Use the thread selector to control which threads are shown in the tree view and in the graph:
Incl. Time Use this selector to choose the meaning of the time displayed.
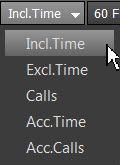
- Incl. Time - (Inclusive time) The time spent in this function inclusively.
- Excl. Time - (Exclusive time) The time spent in this function exclusively.
- Calls - The number of times this function was called in the frame.
- Acc. Time - (Accumulated time) The total amount of time spent in this function up to the frame being analyzed.
- Acc. Calls - (Accumulated calls) - The total number of times this function was called up to the frame being analyzed.
Delta Unused option.
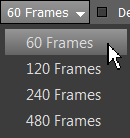
Autozoom When selected, maintains the approximate zoom level (number of frames displayed) whenever the graph changes.
Flat View Flattens the tree of function calls (removes the hierarchical indentation), as in the following image: