IN THIS ARTICLE
Creating and Using Annotations
In Profiler, annotations are a convenient way of highlighting per-frame log information from the data captured from your application. After you learn how annotations are used in Profiler, you can modify your application so that they appear in Profiler.
Topics
Using Annotations
Annotations in the O3DE Profiler tool flag frames in your captured data that have associated log information. By default, annotations are turned off.
To use annotations
- To turn on annotations in the O3DE Profiler tool, click Configure Annotations:
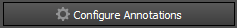
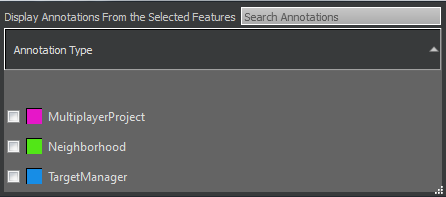
The Configure Annotations dialog box contains a list of available annotations and their display colors. For information on creating annotations for your application, see Creating Annotations .
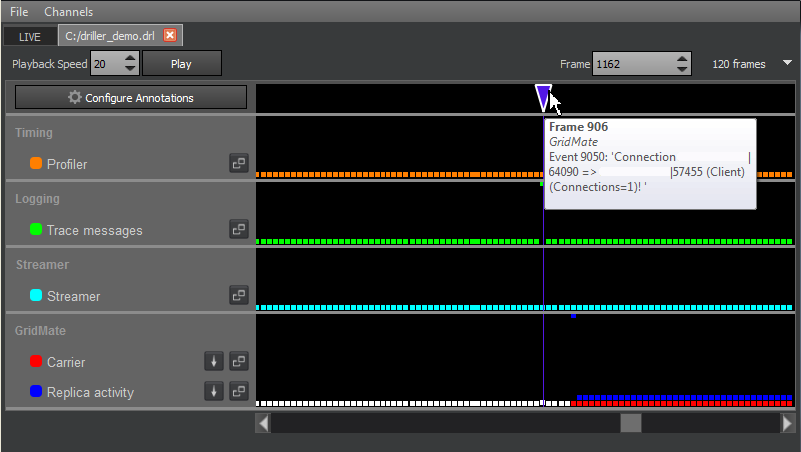
- When you select an annotation in the dialog box, a marker and line of the same color appears in the channel display. Note that you might have to scroll horizontally to find the marker.
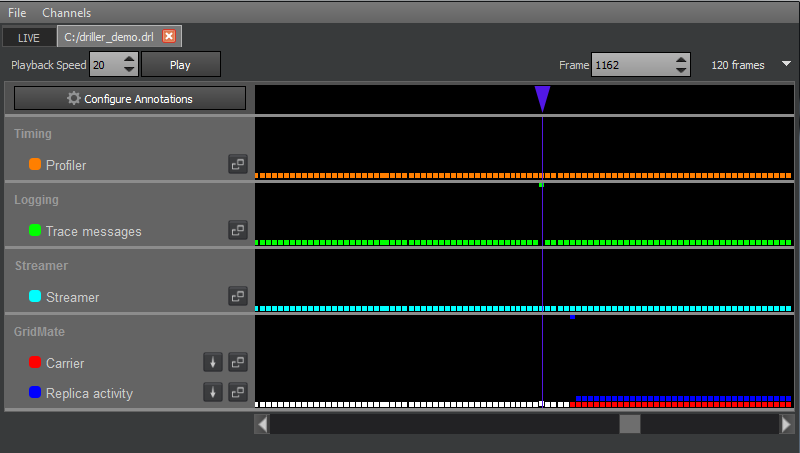
- To display details for the annotations that occurred on a frame, pause your pointer on an annotation marker. In the example image, IP addresses have been redacted out.
Creating Annotations
To create an annotation, you add one or more lines of C++ logging code to your application. The added code instructs O3DE’s logging system to include the logging information that you specify as a part of your capture. O3DE transforms the logged messages into annotations for you. Then, in Profiler, when you click Configure Annotations, you actually choose which system’s annotations are displayed (for example, GridMate or MultiplayerProject).
To create an annotation, place a line of C++ code like the following in your application:
AZ_TracePrintf("GridMate","Connection %s => %s (%s) (Connections=%d!\n")
The first parameter is the window (that is, system) of the trace (in this case, GridMate), and the second is the content of the trace that will be shown as the annotation.
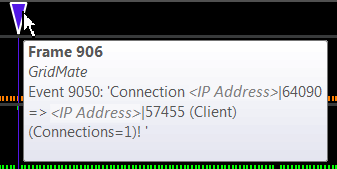
The example results in the following annotation text:
GridMate - Connection <IP_Address>|64090 => <IP_Address>|57455 (Client) (Connections=1)!
The text displays in Profiler like this:
Alternatives to AZ_TracePrintf
In your code, instead of using AZ_TracePrintf, you can use AZ_Error or AZ_Warning, depending on the degree of severity that you want. AZ_TracePrintf always logs a message, but is of the lowest concern from an inspection viewpoint.
The following example uses AZ_Error:
if (networkTableContext.ReadValue(elementIndex,forcedDataSetIndex))
{
    AZ_Error("ScriptComponent",forcedDataSetIndex >= 1 && forcedDataSetIndex <= ScriptComponentReplicaChunk::k_maxScriptableDataSets,"Trying to force Property (%s) to an invalid DataSetIndex(%i).",scriptProperty->m_name.c_str(),forcedDataSetIndex);
    if (forcedDataSetIndex >= 1 && forcedDataSetIndex <= ScriptComponentReplicaChunk::k_maxScriptableDataSets)
    {
        networkedTableValue.SetForcedDataSetIndex(forcedDataSetIndex);
    }
}
else
{
    AZ_Error("ScriptComponent",false,"Trying to force Property (%s) to unknown DataSetIndex. Ignoring field.", scriptProperty->m_name.c_str());
}
In the example, if either of the error conditions occur, an annotation is created.
Viewing Annotations in Trace Messages Profiler
Another way to confirm that your annotations are in place is by using the Trace Messages profiler.
In the Profiler Logging channel, click the Trace messages profiler details icon to see the logging systems currently in place:
![]()
The Trace messages profiler instance shows all the trace messages that were generated from the start of the capture to the currently analyzed frame. Messages are shown with the oldest message at the top and the newest message at the bottom:
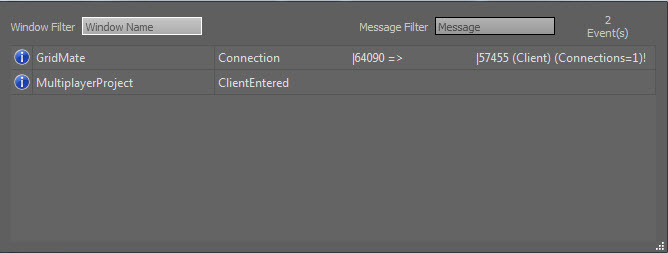
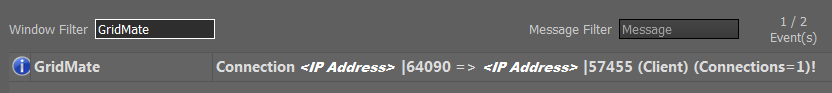
You can use the Window Filter to show the system and/or Message Filter to show the message text that you are interested in.
The following example, filtered by “GridMate”, shows the message specified by the line of code that was added to the application: