IN THIS ARTICLE
Debug Menu Samples
The Atom Sample Viewer debug menu samples demonstrate the various profiling and debugging tools you can use with Atom Renderer. From the debug menu, you can capture frame data, analyze threads, view stats, and visualize CPU and GPU profile data.
To do:A GitHub issue has been created for this task here.
CPU Profiler
Atom Renderer’s built-in CPU Profiler widget collects and visualizes runtime statistics and data from rendering threads on the CPU.
To open the CPU Profiler widget, click on Profile → CPU Profiler from the ImGui debug menu. You can access the ImGui debug menu in the Editor by pressing the Home key.
High-level Toolbar
The CPU Profiler widget has two views: a statistics view and a visualizer. These two views share a common header for controlling the profiler.

| Tool | Description |
|---|---|
| Swap to statistics/visualizer | Swaps between the statistics and visualizer views. |
| Resume/Pause | Starts/stops Atom profile data collection. |
| Capture | Captures a single frame of CPU profile data. The collected data is saved to /<project>/user/CpuProfiler/. |
| Begin/End | Starts/stops a capture of continuous frames of CPU profile data. The collected data is saved to /<project>/user/CpuProfiler/. |
| Load file | Opens the File Picker window, which lists all of the capture files in /<project>/user/CpuProfiler/. The files are sorted in descending order according to modification time, with the most recent capture at the top. Refer to
Loading Captures
. |
Loading Captures
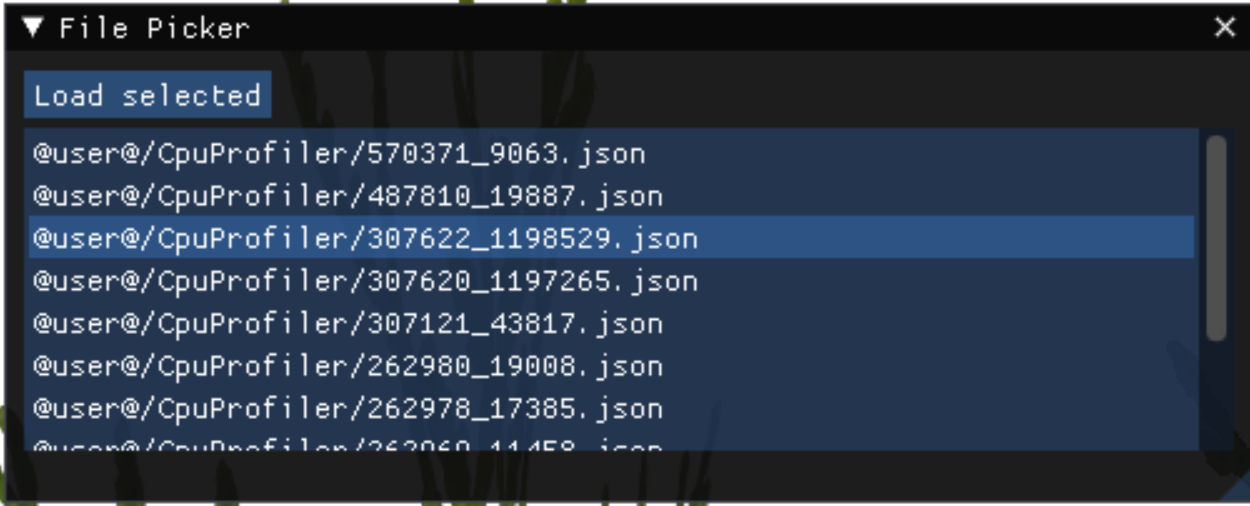
CPU Profiler allows you to capture CPU profiling data at a specific time-frame, which you can load and view in the statistics or visualizer views.
To load captures of CPU profiling data:
- Click Load file in the CPU Profiler’s Toolbar to open the File Picker window.
- Select the capture that you want to load. Captures are stored as
.jsonfiles in/<project>/user/CpuProfiler/. - Click Load selected to load the selected capture into memory. This displays the captured CPU profiling data in the main CPU Profiling window.
Statistics
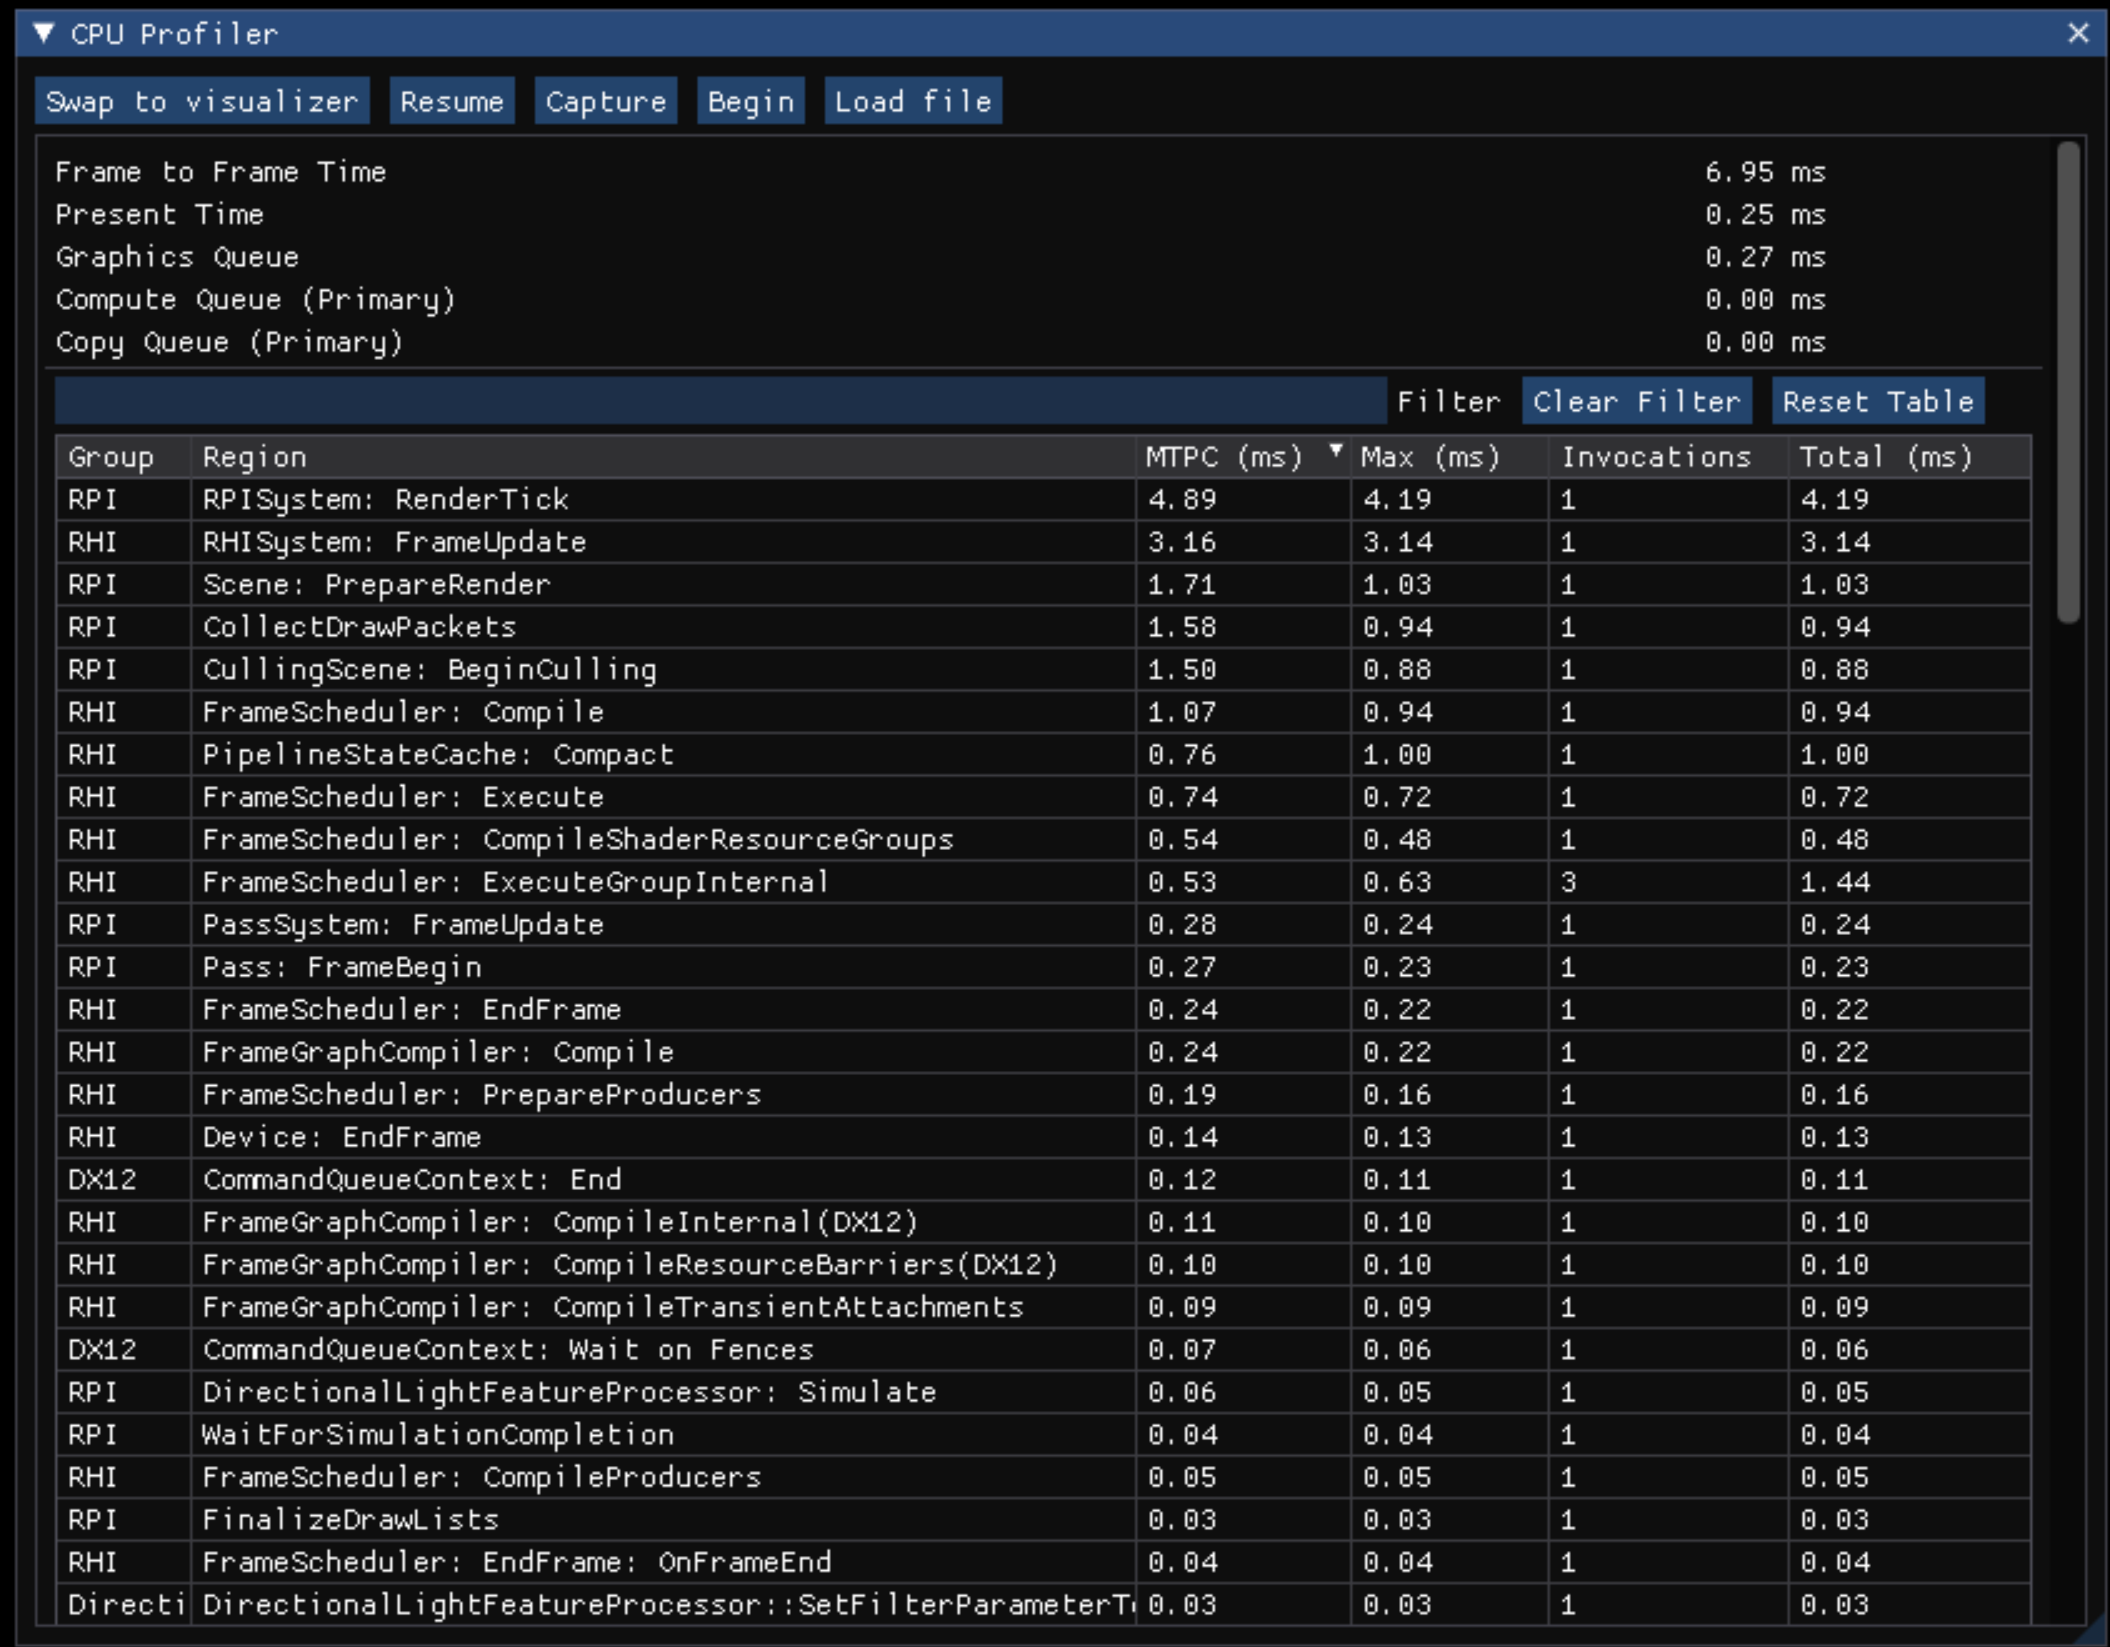
The statistics view processes and displays the quantitative data that Atom’s CPU Profiler collects. Each row in the table represents a specific profiling region. You can sort the rows according to column values by clicking on the column headers:
| Column | Description |
|---|---|
| Group | The overall renderer area (RPI, RHI, or DX12, for example) of the profile region. |
| Region | The lower-level name of the profile region, which is often the name of a function call. |
| MTPC | The mean time per call in milliseconds of the profile region aggregated across all of the data collected. |
| Max | The maximum runtime of the region in milliseconds during the last frame’s execution. For regions that only appear once in the last frame, this will be equal to the total time. |
| Invocations | The number of times that the profile region ran in the last frame. |
| Total | The overall time in milliseconds this profile region required on the last frame, summing up each invocation of the region. |
You can also filter rows by entering a specific group or region name in the text field and clicking Filter. To remove the filter, click Clear Filter. To clear all of the table’s saved data, which is recommended when switching sample, click Reset Table.
Visualizer
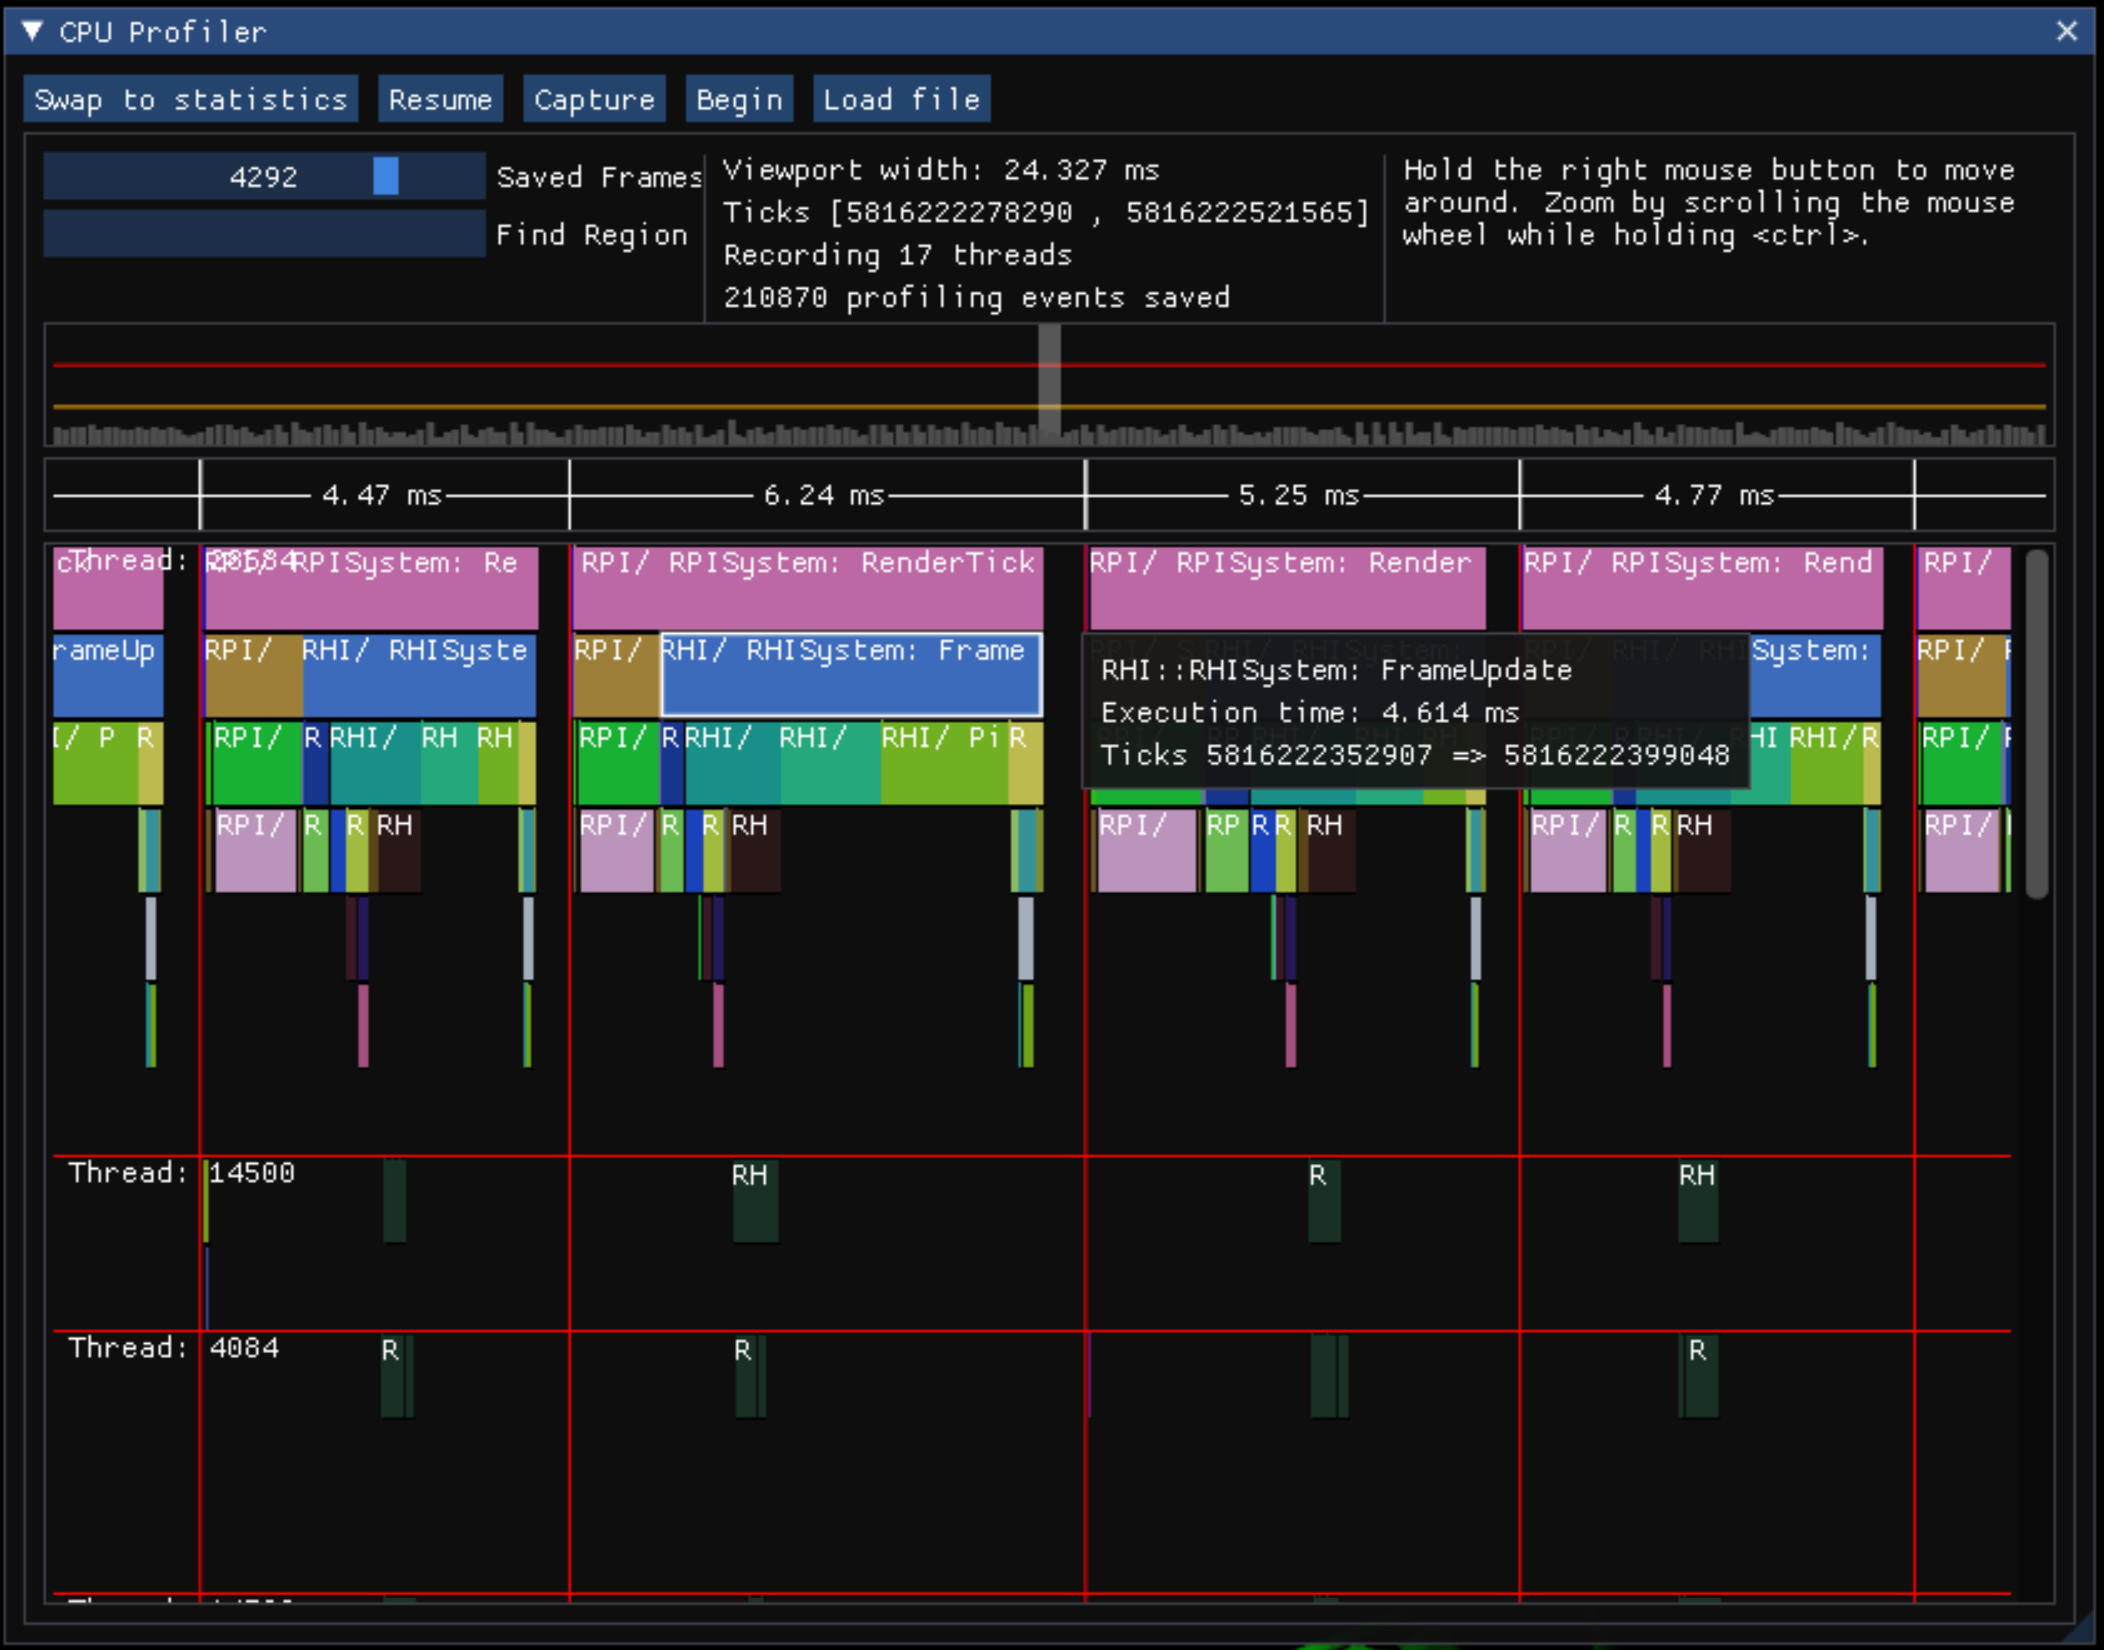
The visualizer presents CPU profiling data in a timeline format, similar to other profilers like RAD Telemetry and Tracy. Each active render thread is laid out horizontally, with every profiling event corresponding to a block in the visualizer. Time increases going to the right.
The histogram at the top of the widget can be used to easily find frames with poor performance. The height of each individual block corresponds to the amount of time it took for the frame to execute. The orange line corresponds to a frame time of 16.6 ms, or 60 FPS, and the red line corresponds to a frame time of 33.3 ms (30 FPS).
You can navigate the CPU profiling data in the visualizer with the following actions:
| Action | Description |
|---|---|
| RMB+Drag | Scrolls through the data. |
| Ctrl+Mouse Wheel | Zooms in and out. |
| Click on a region in the visualizer. | Switches to statistics view and filters the data by the selected region. |
| Adjust the Saved Frames slider. | Adjusts the number of frames that you want to save within the profiler. |
| Enter a region name in the Find Region text field. | Filters the regions that’re drawn in the histogram. |